
PRECISION
CHARTING
PROTOCOLS.
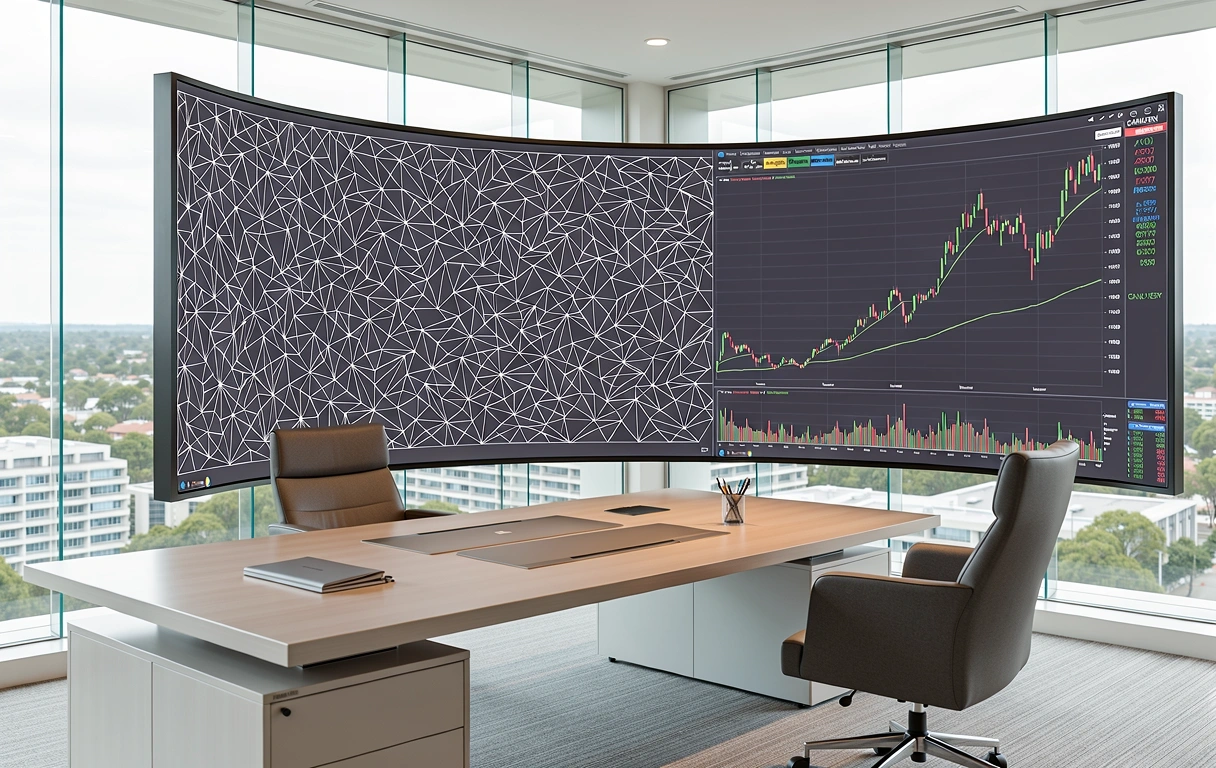
Mostlinora Digital provides the structural framework for navigating Australian equity and global forex markets. By leveraging the advanced engine of TradingView, we move beyond basic patterns into institutional-grade market interpretation.

Core Analysis Framework
We do not predict the future; we quantify current probabilities using a disciplined documentation of price action and volume profiles.
Multi-Timeframe Confluence
Effective technical analysis requires viewing the market through multiple lenses. We teach our analysts to verify high-timeframe trends before executing on shorter intraday setups within the TradingView environment.
- Primary Trend Confirmation
- Fractional Entry Points
Volume Profile Distribution
Price alone is an incomplete narrative. By analyzing Volume at Price (VAP), we identify high-value nodes where institutional interest is concentrated, providing critical support and resistance levels.
- Point of Control (POC)
- Value Area Extremes
Momentum Divergence
Exposing the exhaustion of price moves through RSI and MACD divergence protocols. This early-warning system allows for proactive risk management rather than reactive panic near market turns.
- Oscillator Calibration
- Trend Exhaustion Metrics

Mastering the
TradingView Stack.
Custom Pine Script Deployment
Go beyond native indicators by coding bespoke alerts and strategies tailored to the Australian market's unique liquidity cycles and opening hour volatility.
Advanced Charting Layouts
Efficient screen real estate management using synced multi-chart layouts. Monitor correlated assets like AUD/USD and Gold prices simultaneously for inter-market analysis.
Automated Alert Systems
Set condition-based notifications that trigger on price breaks or indicator crosses, ensuring technical opportunities are never missed during out-of-market hours.
Navigating the ASX Sector Rotation.
In early 2026, our analysis identified a significant shift in capital flow within the Australian resource sector. Using the TradingView Relative Rotation Graph (RRG) logic, we mapped the transition of blue-chip mining stocks from the 'Leading' quadrant to 'Weakening'.
This technical signal preceded a 12% sector correction over the subsequent three weeks. Mostlinora Digital students were trained to recognise this pattern of lower-highs combined with negative volume delta—a textbook example of institutional distribution.
Understanding these technical nuances is the difference between catching a falling knife and entering a high-probability reversal.
Your Technical Evolution.
Transition from an observer to a market surgeon with our structured curriculum designed for the Australian financial landscape.
Foundation & Tooling
Setting up professional-grade TradingView environments, mastering keyboard shortcuts, and understanding the core mechanics of order flow.
Strategic Execution
Developing a rule-based trading plan that combines Fibonacci levels, order blocks, and supply/demand zones with strict risk parameters.
Physical Location
200 Commonwealth Avenue, Canberra ACT 2600, Australia
Technical Support
+61 2 6287 6046 | [email protected]
Current Session
AEST: 9:00 - 17:00 (Mon - Fri)